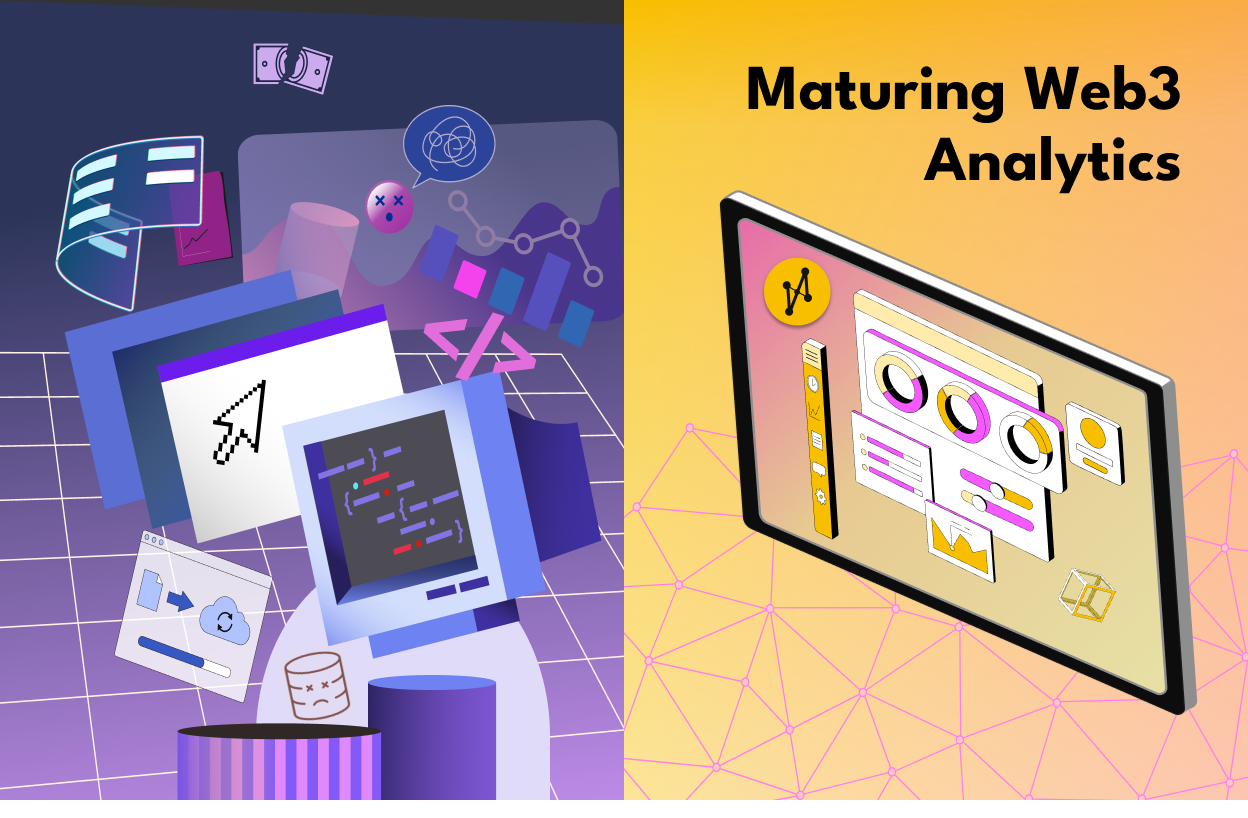
Maturing Web3 Analytics
Metrics are abundant. But where are the insights?
Introduction
The year was 2021, and Web3 Analytics was broken. Crypto Twitter was bickering over whether a specific project "was on the upswing or downswing” as people cited different data sources. We were dumbstruck: wasn’t the blockchain an irrefutable source of truth? There were unreliable screenshots of on-chain charts circulating, but you were faced with decoding 700 lines of convoluted SQL when you finally tracked down the source chart. Alas, ChatGPT wasn’t around to explain if or how it all worked…
In that moment, we realized the need to solve the problem of explainable on-chain insights. Not “SQL to query on-chain data” (which exists in abundance), but to enable anyone to explore and discover new and unique blockchain insights that are actionable. Welcome to Web3 Analytics in 2024, powered by HyperArc.
Insights vs. Metrics
We believe that a nascent space often starts out by relying on basic metrics and slowly undergoes a maturation process in order to develop more advanced insights. So what exactly is the difference?
Metrics are one dimensional and standardized by design. They're great for reporting and accounting. Insights are dynamic, multidimensional even. Metrics help you understand the status quo and compare historical performances. Insights uncover second order questions and empower better decision making. In today’s Web3, metrics are abundant (TVL, Volume, MAU etc.), but insights remain scarce. So how do you discover insights? The answer - lightning fast interactive exploration.
In today’s Web3, metrics like TVP and Volume are abundant, but insights remain scarce. So how do you discover insights? The answer - lightning fast interactive exploration.
Let’s first try an example to get a better idea. Say 197 wallets signed up for your service last week compared to 167 the week prior, and that these 197 wallets contributed $250k towards deposits. These are metrics, and you can acquire them via SQL which is great for getting top line figures. But theses metrics are not deeply insightful nor are they actionable. So you keep digging with some additional questions:
- How many wallets account for a majority of all deposits? Is there a specific asset that’s dominant? Where did they exit from? What were they doing prior to your platform?
- What other activities are they engaging in? Are they trending up or down?
- Are deposit sizes going up or down? Should you be focused on the super whales or lots of smaller participants?
- How old are these wallets? Could some of them be the same user? How many assets do they own? What chain, protocol, or project are they most familiar with?
As you work through your questions, you’ll arrive at interesting nuggets of information via 3rd and 4th degree questions. This is the process of insight discovery, and it requires exploration and iteration. Every time you have a question, you’re faced with another SQL query. If your first SQL query was powered by 500 lines of code, how will you know what to edit or fork? But ultimately, insight discovery doesn’t follow a particular path or a formula. This is what our customers rapidly discover by leveraging re-usable analytics components and our platform features - super charge your data scientists and analysts and/or partner with us by coming to the table with your curiosity.
When I was building my first startup in 2015, I was invited to a private YC talk by a key executive at one of the current web2 social media titans (the name will be kept confidential). Throughout the night we talked about how they built the acquisition and retention machine that generated tens of billions $USD in real revenue. Despite growing into a labyrinthine and mystical cash printing machine today, the speaker shared that it all started with a simple insight:
“we discovered early that if a user joins and connect with (follow/add) x other users, takes y actions (e.g. posts/comments) within the first z days, there is a 91% chance that they’d still be an active user in 3 months.”
Once this insight was discovered, the rest was easy - drive and incentivize your users to take such actions. Rapidly discover new insights as you scale. Rinse and repeat.
When we look at Web3, we see a lot of metrics like TVL and Volume. Yet these metrics only tell you how you’ve been doing and not unique actionable insights. The metrics also become stale and require a “refresh,” and worse yet, require a data scientist to interpret. So ask yourself - what insights are you missing out on? Only when we uncover enough insights, can we collectively start finding product market fit to drive the mainstream adoption of Web3. So let’s work together on that journey.
Our Customers
By the end of 2023, our customers collectively boasted more than $4B USD in TVL. But that’s just a metric; we’ve helped them understand not only their own users and protocol performance, but also their competitors and general market trends.
But Web3 data is also useful to those who haven’t deployed their own on-chain contracts. For example, we help media companies discover new insights to write about. We allow creators to design beautifully interactive DataApps powered by real time data to engage their followers. We partner with agencies to uncover industry trends. If your world can benefit from the rapid discovery of Web3 insights, give us a call.
Our Product
So how does it all work? SQL is great at calculating metrics that you already know about, but we knew that an interactive app experience is essential to discovering insights and answering your second order questions. So we built our platform from the ground up (including investing our own query and ETL languages, indexer/decoder, and dedicated query infrastructure) to support this vision.
You can learn more about the details here and our plan for open sourcing some of the technology. All of these technical achievements lead us to the HyperArc Platform: an interactive and code-less interface that supports lightning fast exploration (HyperArc Queries), powered by real time streaming data, and a best in-class interactive dashboard builder: HyperArc DataApps.
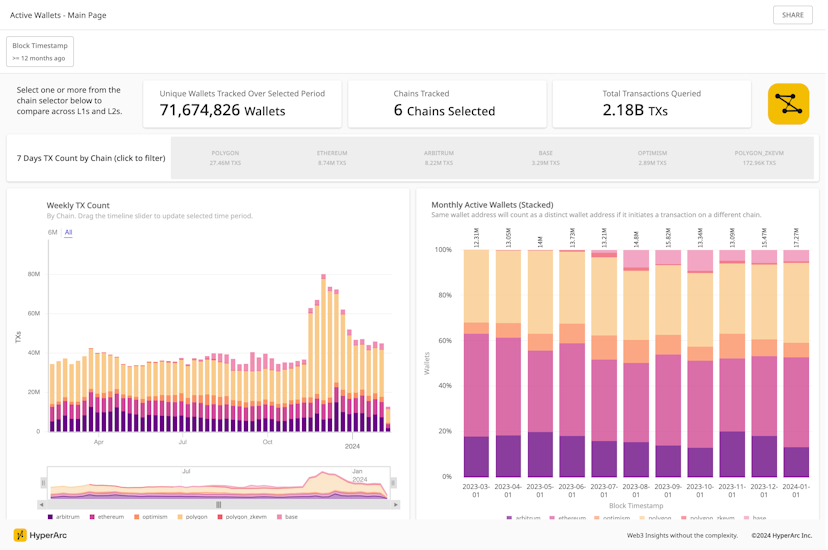
But a picture is worth a thousand words, and a live demo is worth at least twice as much. These two images give you a taste of how HyperArc works, its ease of use, and its speed:
Click to enlarge
----------
Click to enlarge
Our customers have been able to reduce the time between ideation and insight discovery by 90% over traditional SQL for on-chain data tools. Come get a demo to see what we can do for you.
Who We Are
We’re a proud group of software veterans (and Web3 degens) who previously led various functions at Google, Salesforce, Stripe, and many other fast growing startups, where we dealt with deriving useful insights and analytics from data on the order of trillions of rows across billions of users. We felt that web3 adoption was taking longer than we liked, so we embraced our degen-selves and embarked on this journey in 2021. We’ve been having a blast building the product and partnering with some of the top protocols in stealth, and we’re excited to finally open it up to the world.
We’re also actively hiring! Check out our job postings here.
Now, please go ahead and try out HyperArc! We have three great DataApps for you to start exploring and discovering insights:
Let us know if you have any feedback!