Mainnet is losing transactions… is ETH in trouble?
Let's see where an exploration into ETH usage takes us
(You can find the DataApp this post references here)
GM. Sorry for the click bait title… the answer to “Is Eth in trouble” is relatively simple - a resounding no! But how do you know? Let’s take a more in depth look.
One of the most discussed topics these days is the incredible price action. But in this blog post, we’ll dig beyond prices and into transactions and active wallets over time. In the context of the blog, we’ll be mainly looking at Ethereum Mainnet, Polygon, Arbitrum, Optimism, Polygon zkEVM, and Base.
Transactions Over Time
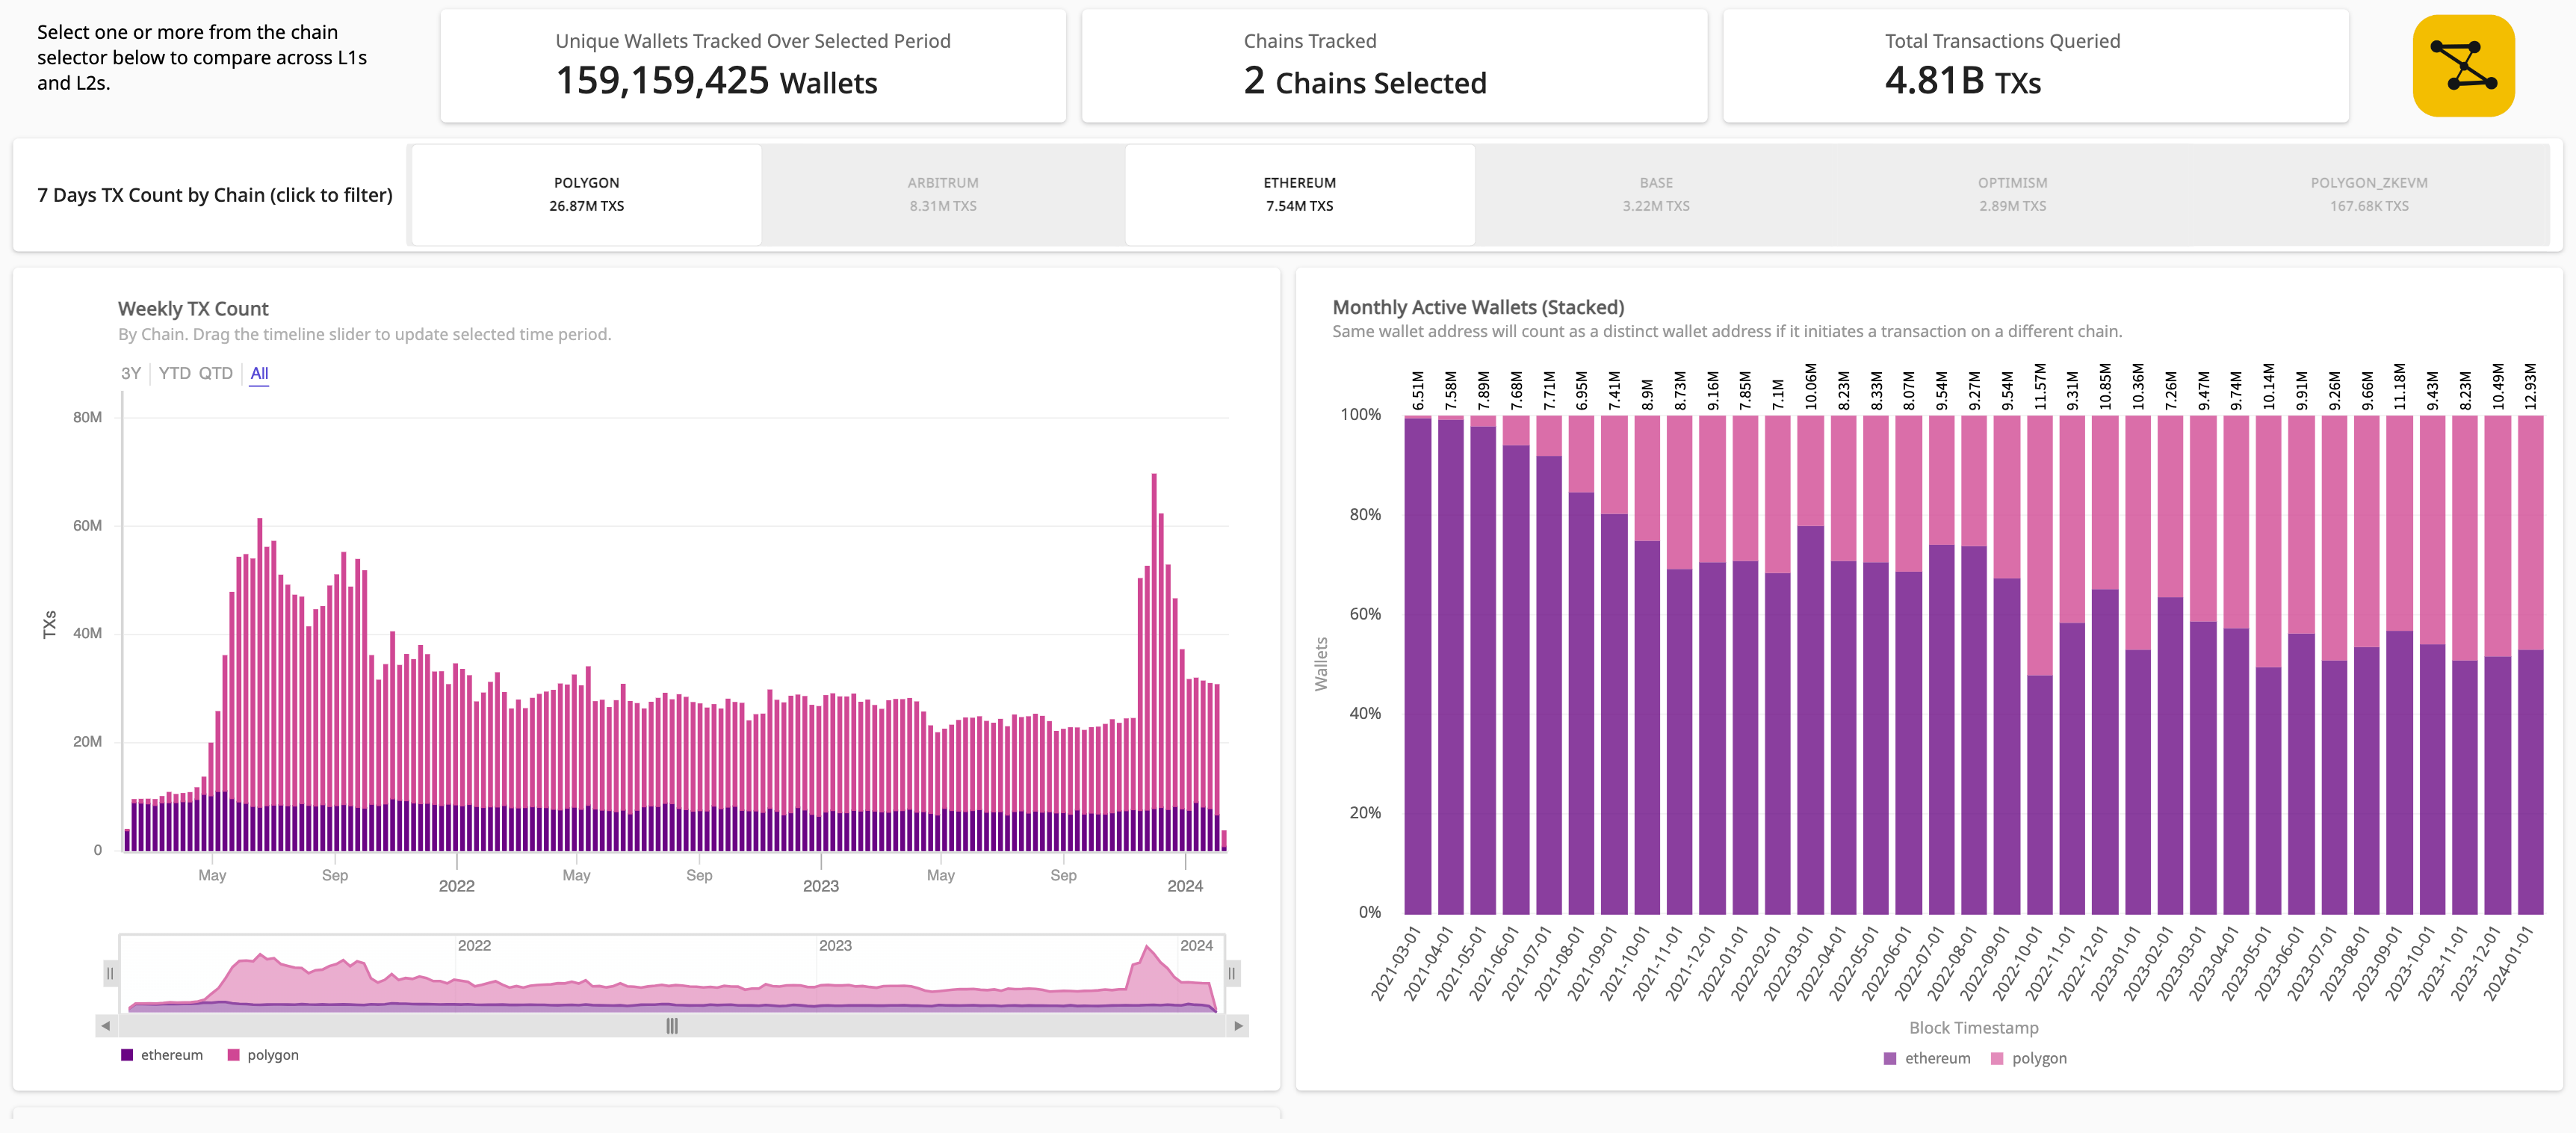
One of the big question in Web3 is simple - are we doing more stuff on chain? By interacting with the chart and looking at our 3 years historical, we can quickly see that weekly transaction counts in early 2021 hovered at around 9.5m weekly. This was mainly dominated by Ethereum and Polygon. As we entered the bull market of summer of 2021, transaction count explodes. The significant rise was mainly driven by an increase in transaction count on Polygon, reaching over 60m transactions in a single week in June 2021.
During this time, the transaction count on Ethereum mainnet remained relatively steady while Polygon took over the market in volume. Interestingly the actual active users in the month with the highest transaction count (June 2021) heavily skewed Ethereum Mainnet as opposed to Polygon (despite Polygon dominating the TX count). Where did the transactions come from? This is an area we can dig into further in a future blogpost.
Click to enlarge
On a related note, If you take a closer look, you can even argue that the overall transaction volume on Ethereum mainnet appears to be trending down. Hopefully this justifies our clickbait title. Read on to see why it’s not true!
Click to enlarge
L2s
Rise of the New L2s
When looking at transaction count, we see the rise of L2s starting in mid 2022. While a few launched their public mainnets in 2021, the usage really starts to pick up just as the market turned south. This is another example of Web3 remaining resilient.
Arbitrum vs. Optimism vs. Base
Let’s now take a look at the newer L2s in Arbitrum vs. Optimism vs. Base. When looking at the data, it appears that Arbitrum took an early lead with both transactions and active wallets count. These L2s broke out in August of 2022 when Arbitrum and Optimism each broke 1m weekly transactions. It picked up momentum and peaked in volume in Q1 of 2023.
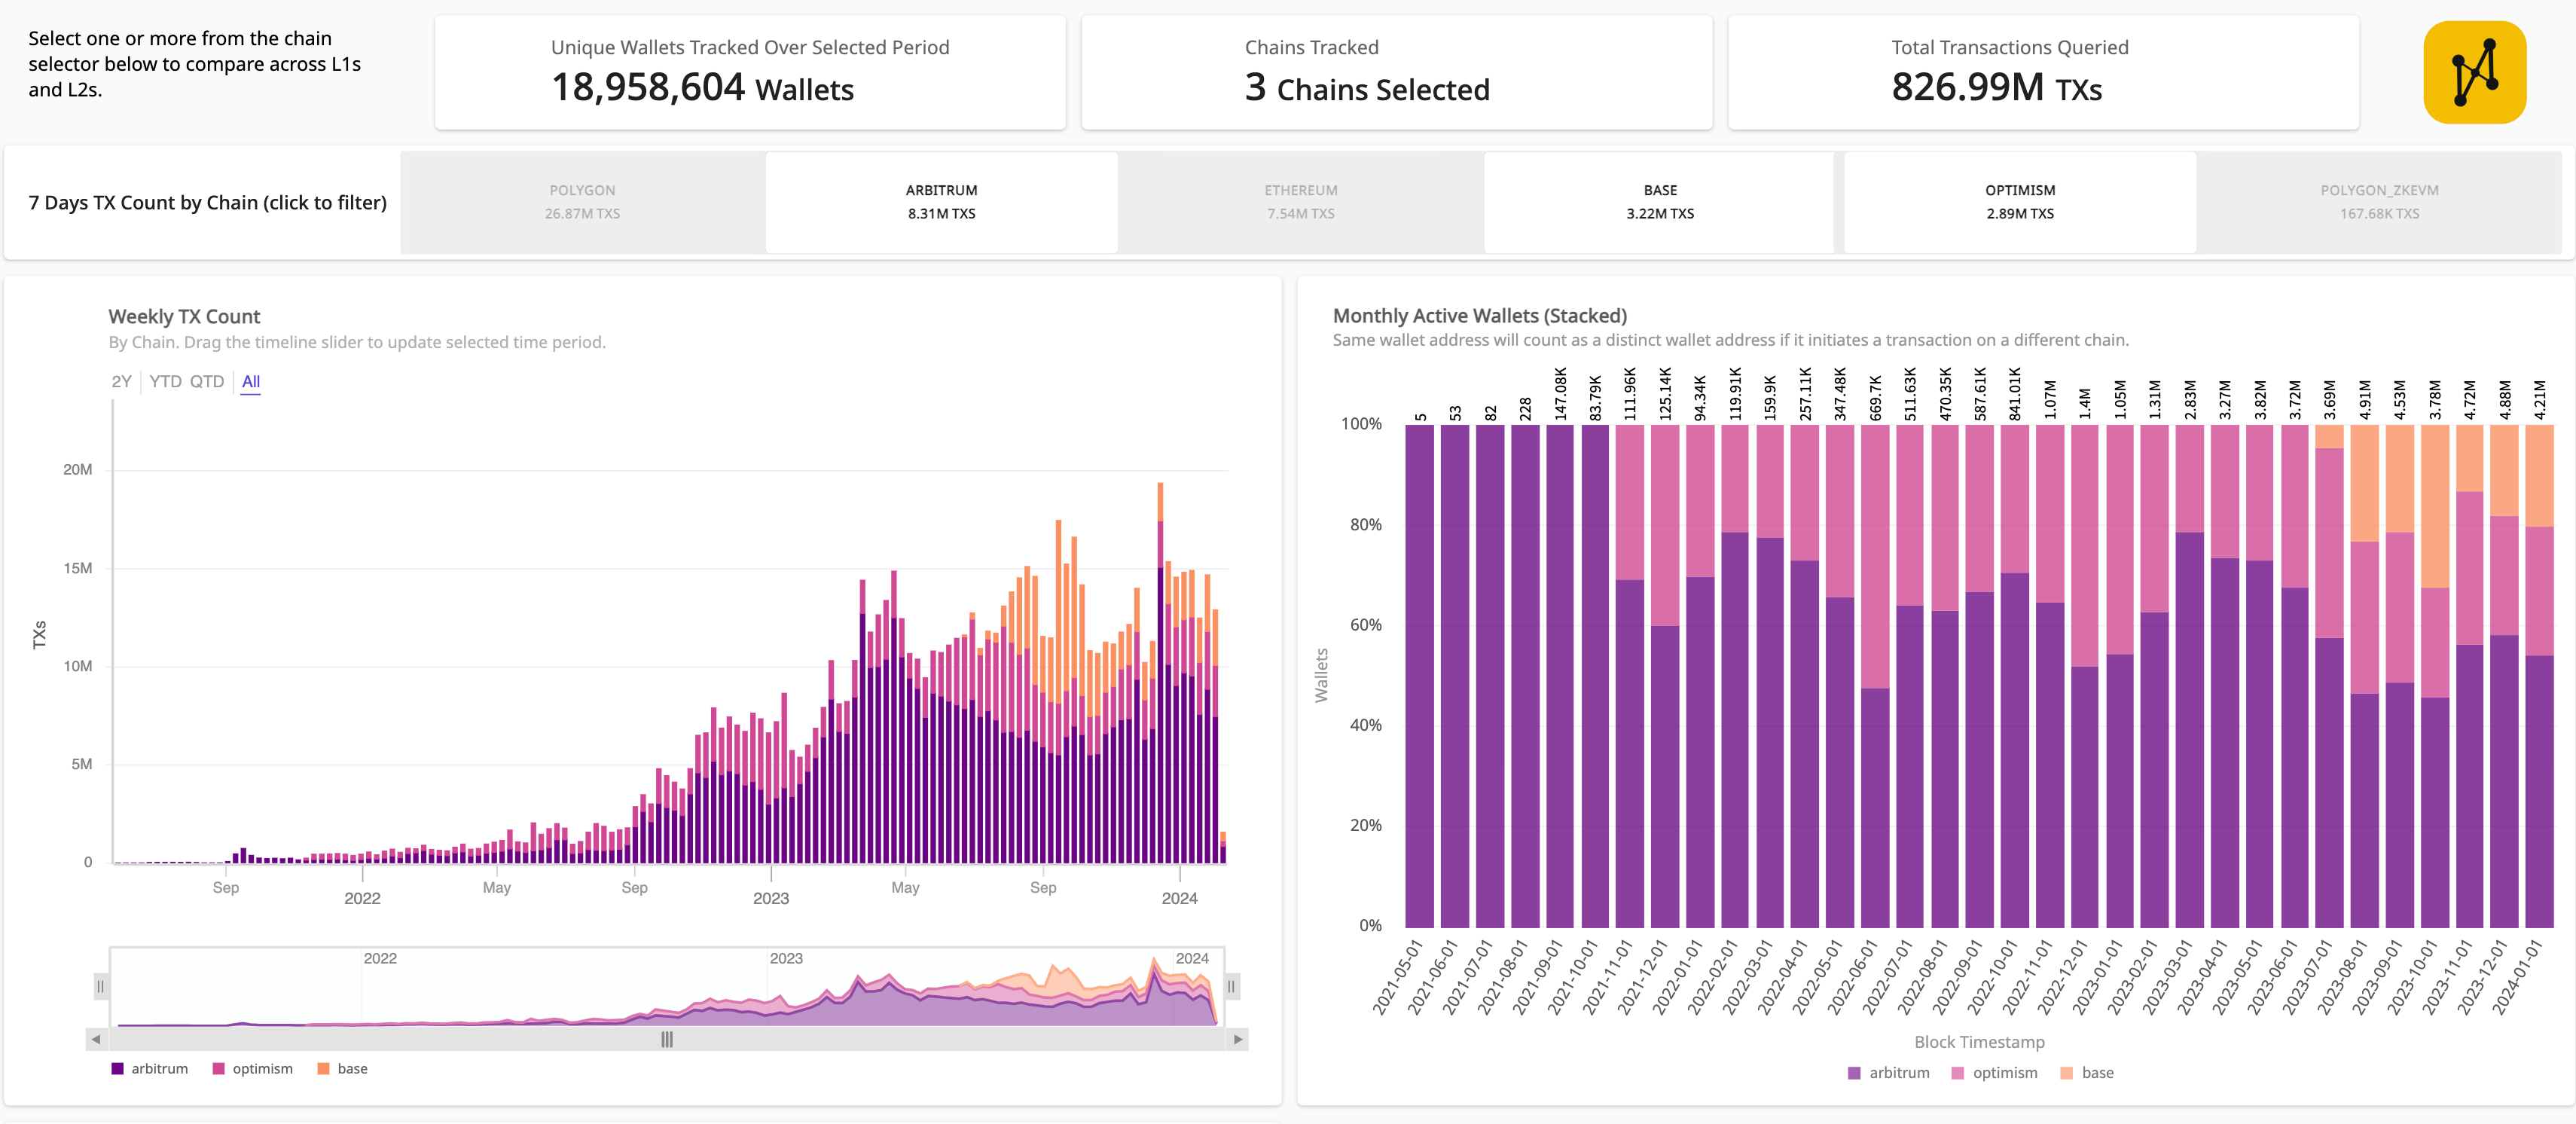
Filtered for the 3 networks
Click to enlarge
We also see that Optimism took the lead in active wallets count in June of 2022 between the 3 networks (albeit Base hadn’t launched). Unfortunately, Optimism hasn’t been able to carry the momentum since then and currently only has a slight edge over Base which is a far newer network. We will dig into Base and how friend.tech impacted Base’s active users over time in another blog post.
We also noticed some interesting behaviors in the actual transactions within Polygon. They have an abnormally high transfer count relative to the transaction count (and the majority of ERC 1155 transfers). We will follow up with another blog post on this topic too.
All in all, adding back in Polygon and you’ll see that these L2s have, in aggregate, surpassed the previous record for transaction count (logged on June 2021) just this last November with almost 19x the active wallets count (462k → 8.76m). The future is bright with the L2s :)
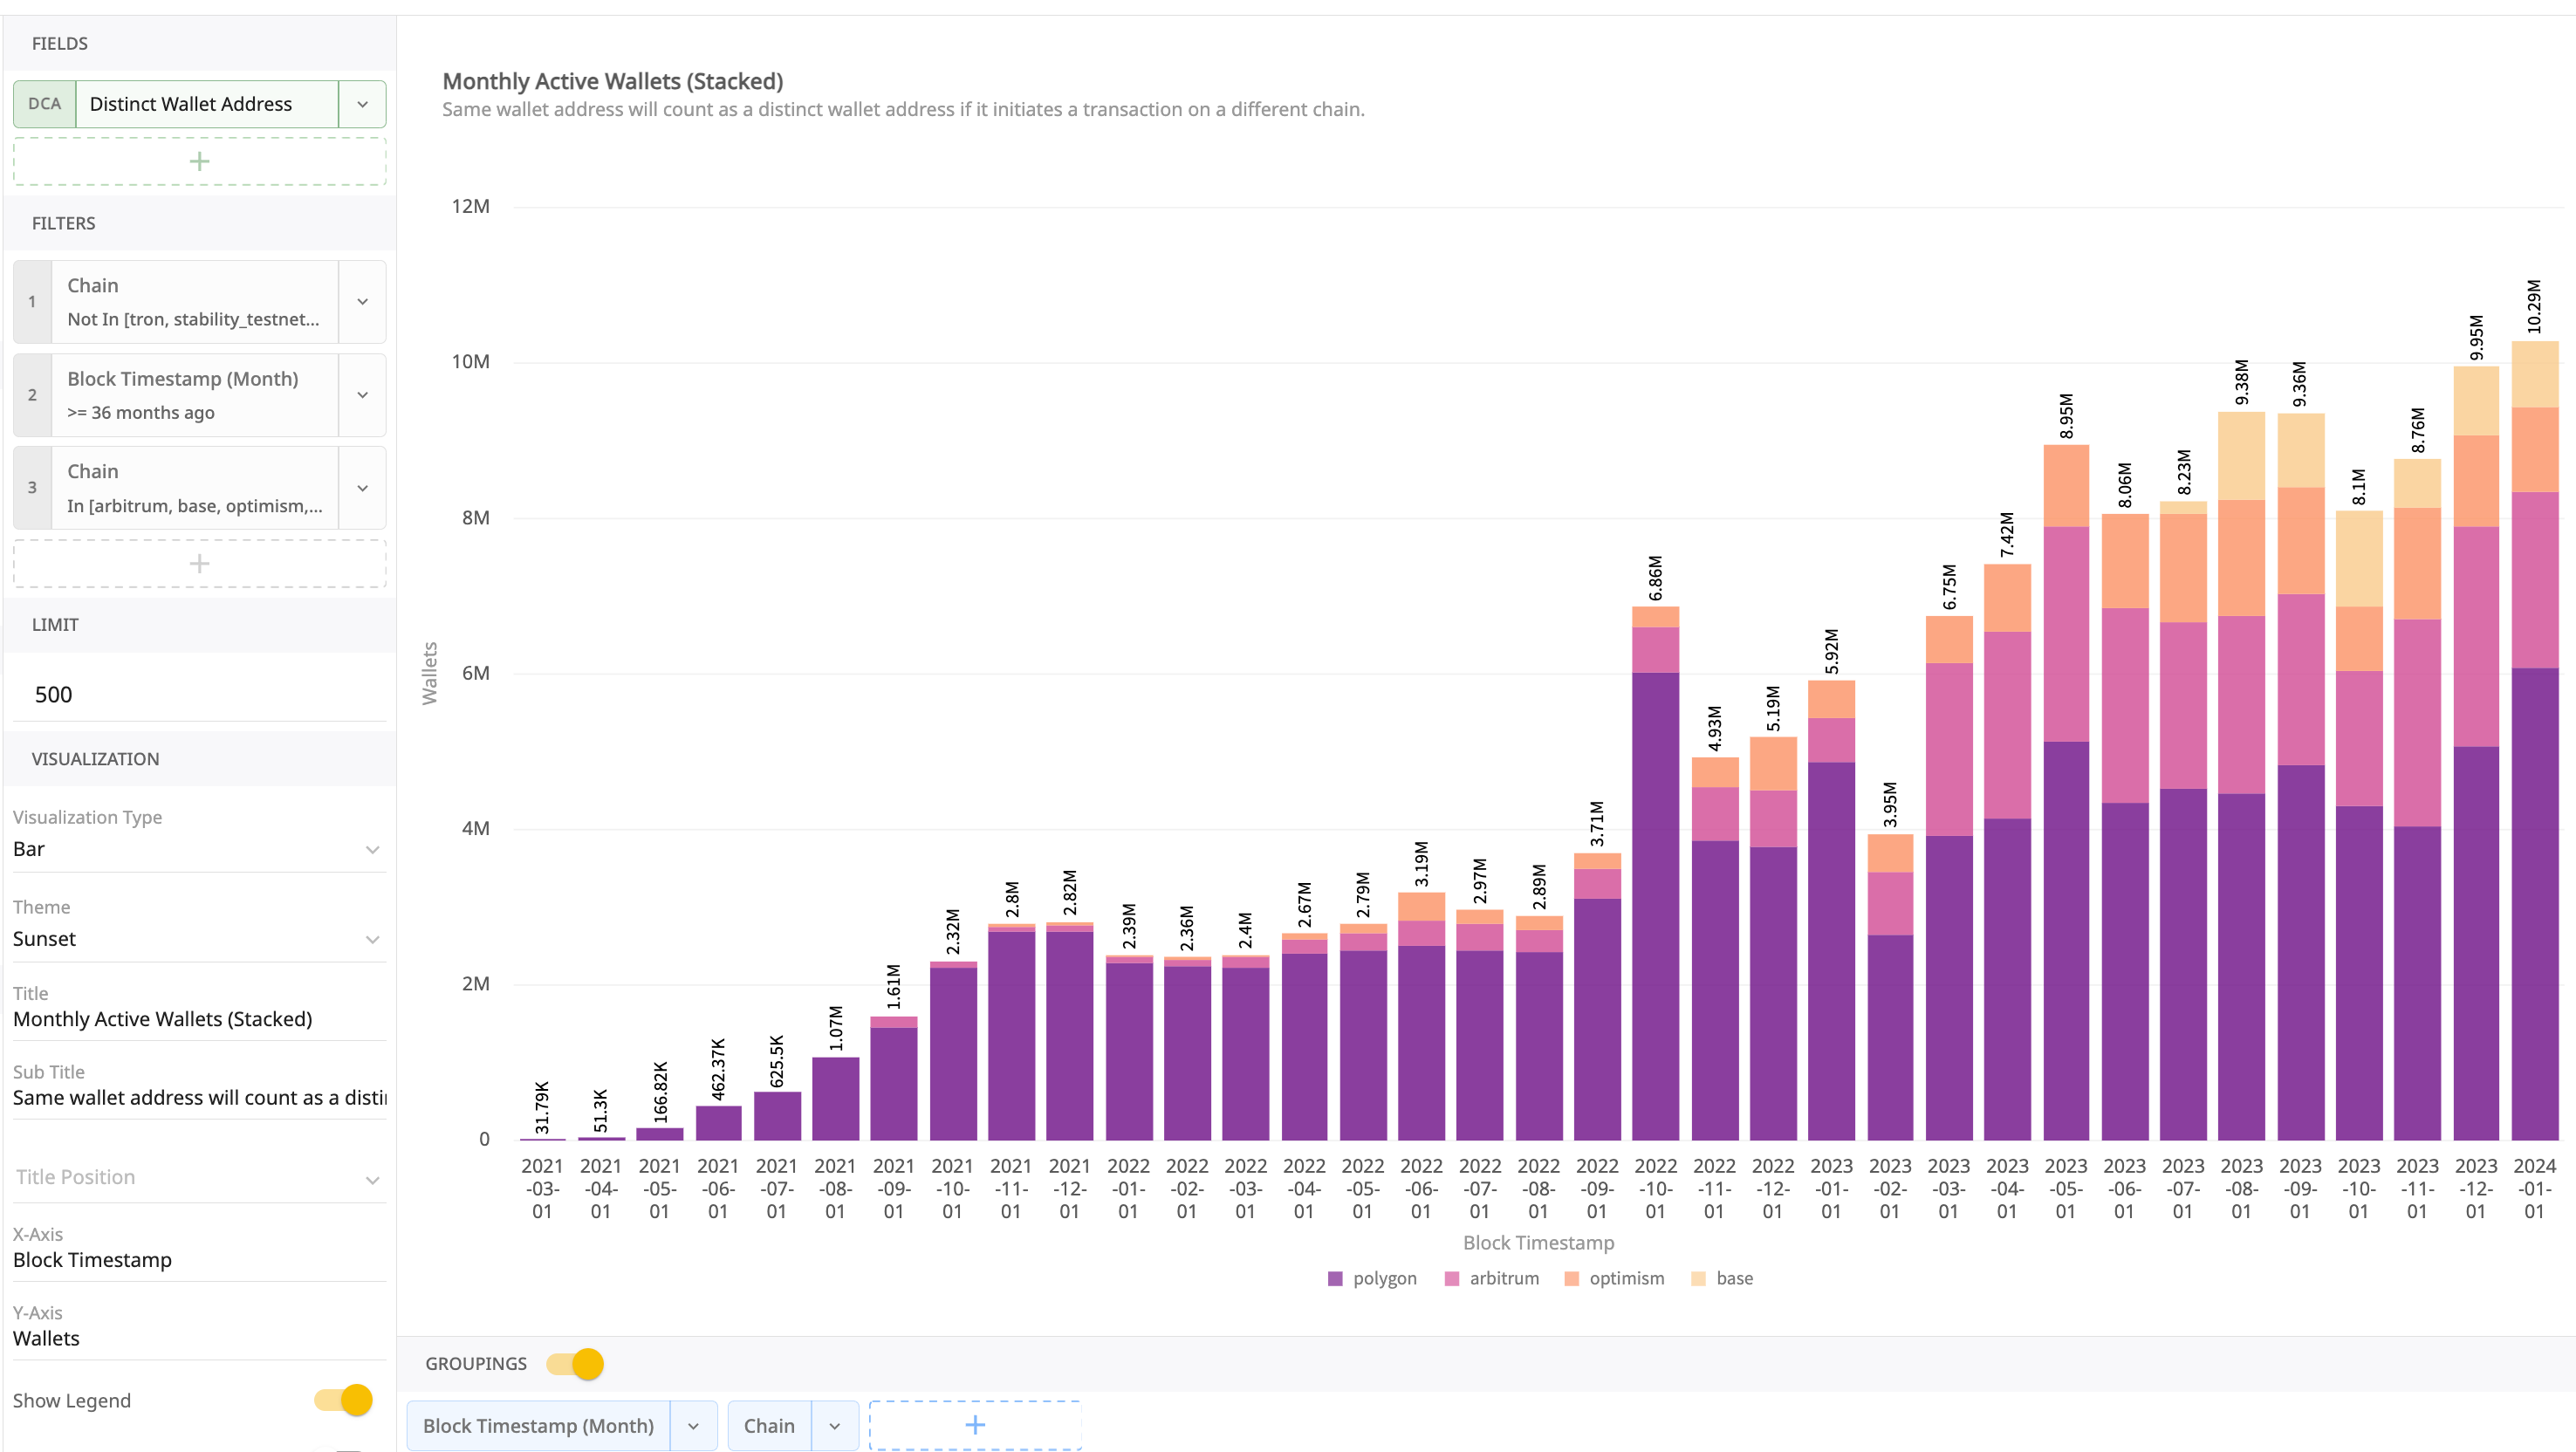
Exploratory analysis on Active wallets for the four L2s, unstacked. If you’re interested in the full power of the platform, reach out!
Click to enlarge
Detour: Meme Coins
What kind of historical data based blog post would it be if we didn’t look into the meme coin craze of 2023? We ran a quick exploratory analysis of summing a group of meme tokens that were sent to any of the Uniswap Routers and deduced that the Meme Coin craze in 2023 started in mid-April (though they existed long before). We’ll take a look at what happened to transactions and active wallets starting around that period accordingly.
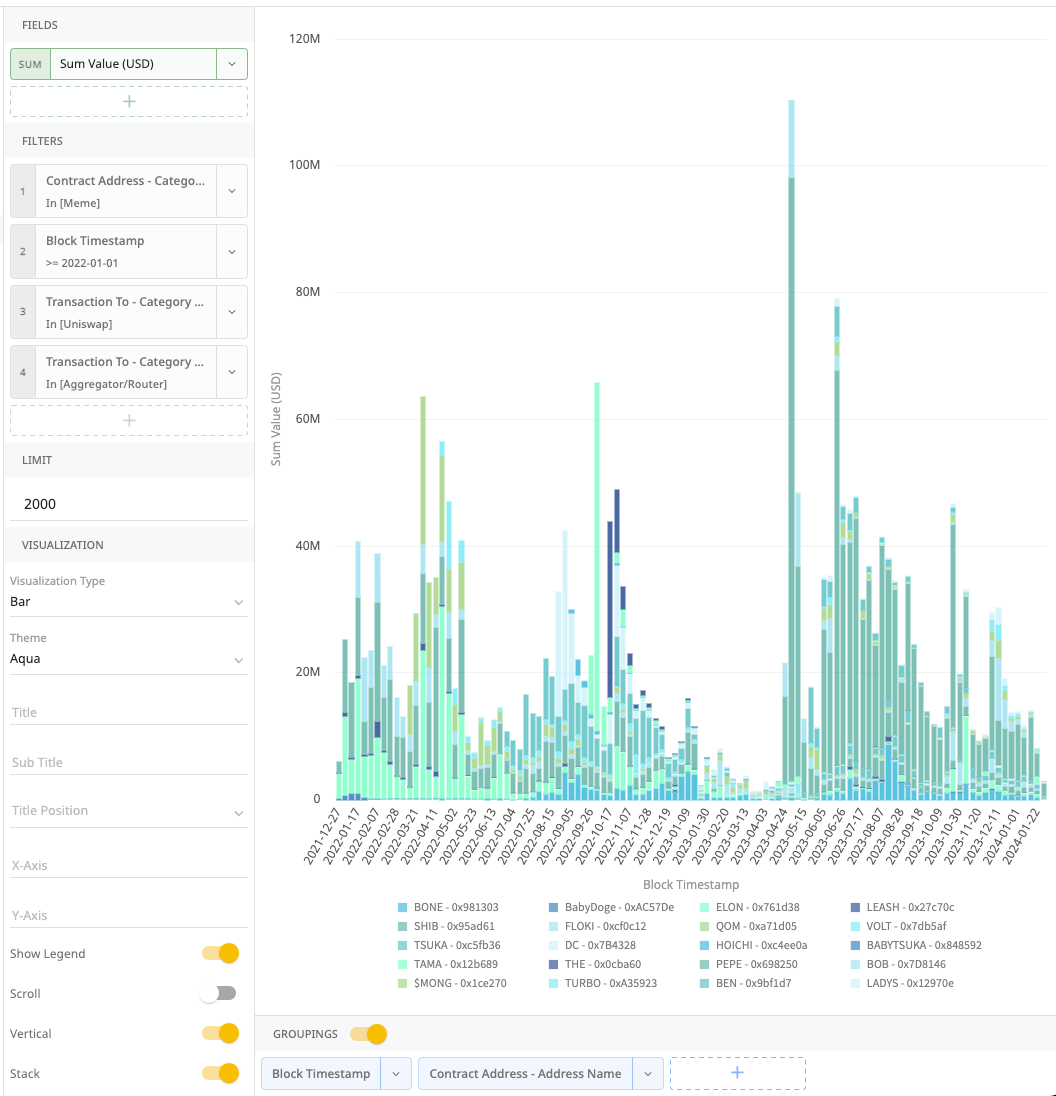
This is an exploration query which isn’t a part of the shared DataApp. The query shows the USD volume of a group of tokens sent to the Uniswap Routers group.
Click to enlarge
Looking at the data, we see an uptick in active wallets for April of 2023, but not significantly more at just around 10% compared to the prior month. The transaction count also didn’t see any major uplift. This is surprising given the price action we saw, but it’s the same old lesson - price action doesn’t equate to engagement and how active a protocol is.

This is an exploration query which isn’t a part of the shared DataApp. The query shows the net new wallets (defined as being in a transaction + conducting a send for the first time) over time per chain.
Click to enlarge
As we look at the trend, it doesn’t appear that the meme coin craze had any major significance in the web3 ecosystem in terms of active wallets. It would be interesting to dig deeper into “new active wallets over time” in a future blog post (along with what is driving the activity!). We did, however, take a quick look and noticed no major uptick in new wallets added during that period either.
Potential Conclusions
It’s hard to draw a “single” definitive conclusion when interacting with blockchain data. If you were passed a screenshot of total transactions on Ethereum mainnet, you’d arrive at the incorrect interpretation of Web3 dying out. But if you take a look at the overall trend, you’ll notice interesting trends around L2s. At the same time, what was a basic blogpost on a simple fact of “are more people using web3” spawned quite a few alleyways to stroll down (not to even mention that a wallet don’t equate to a person). Being able to rapidly and interactively explore the data and dig into 2nd and 3rd order questions like “assets held in the wallets per chain” and “contracts driving the engagement” is key to uncovering useful and interesting insights.
The reality is that we wrote the blogpost to open the door for our readers to explore and discover what is relevant to them. We encourage you to play around with this DataApp to build your own understanding and opinions.
Our belief is that blockchain democratizes the data, and we want every reader to develop the ability interact with blockchain data without forking and modifying any code.
Next Steps
Want to learn how to conduct this type of analysis in minutes without writing any code? Sign up to our newsletter at the bottom of the page and/or request a demo of the HyperArc platform!
--
As a reminder, you can find the DataApp this post references on active Ethereum and L2 wallets here. And also take a look at a DataApp that introduces you to how DataApps work and how to navigate them.