HyperArc Use Cases
HyperArc sets a completely new standard for web3 analytics: it enables true exploration, discovery, action, and collaboration.
Business users and web3 developers alike can ramp up and prepare DataApps in mere minutes.

Business users use our drag-and-drop interface to quickly build queries of any complexity.

Developers can also jump into our proprietary language, or SQL, and generate an API to integrate with their apps.

Teams can share and comment interactive DataApps, fork them, and explore new directions.
DeFi DataApps
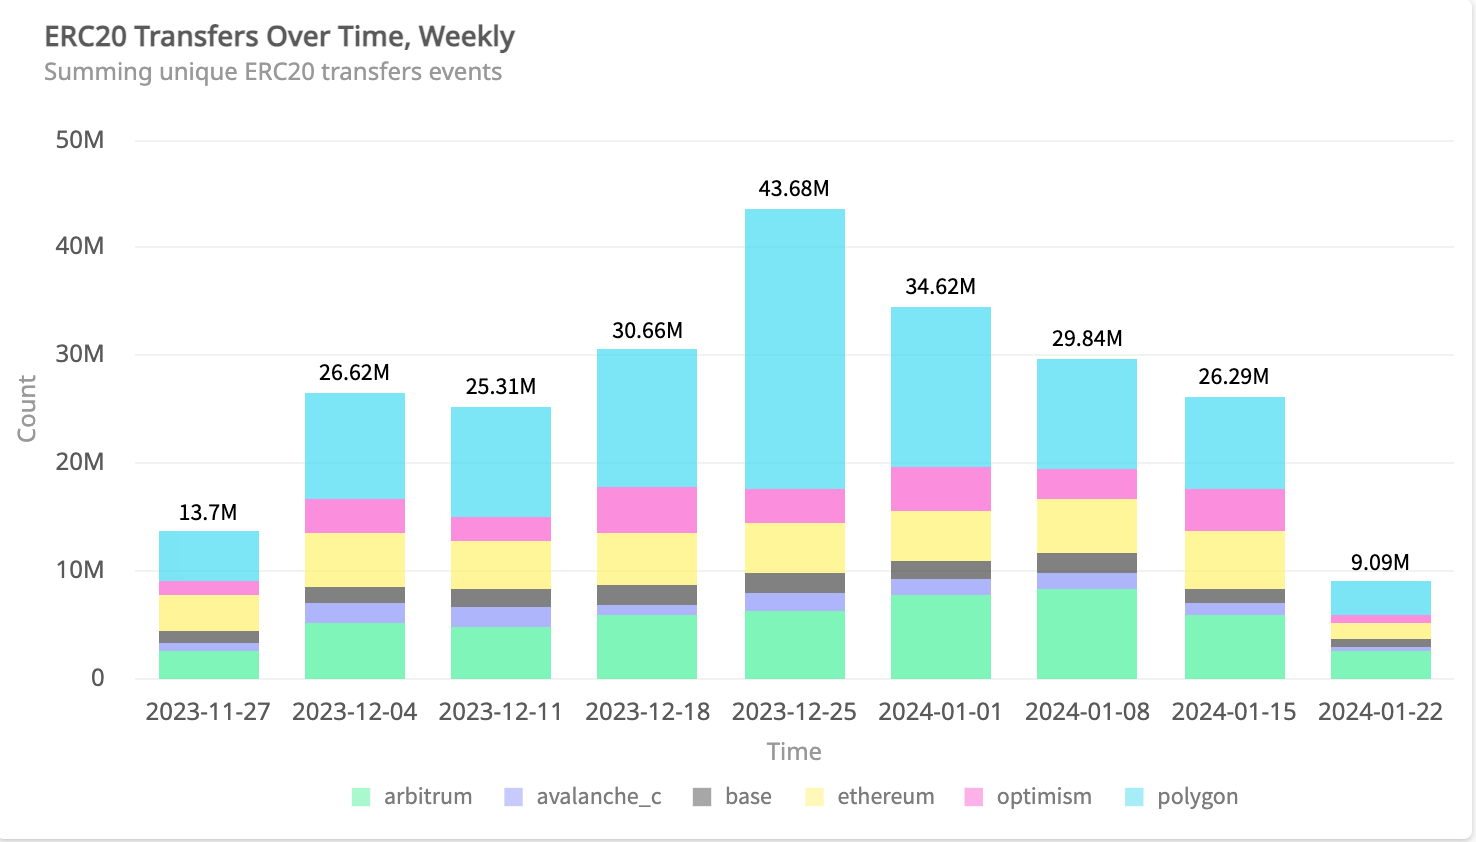
- Show an overview of specific DeFi token transfers over a period of time, segmented by wallet/user type
- Dig into the activity on a specific DEX to see what assets are most active and trending
- Observe a high-volume period to see what addresses drove the action and how gas prices were affected


NFT DataApps
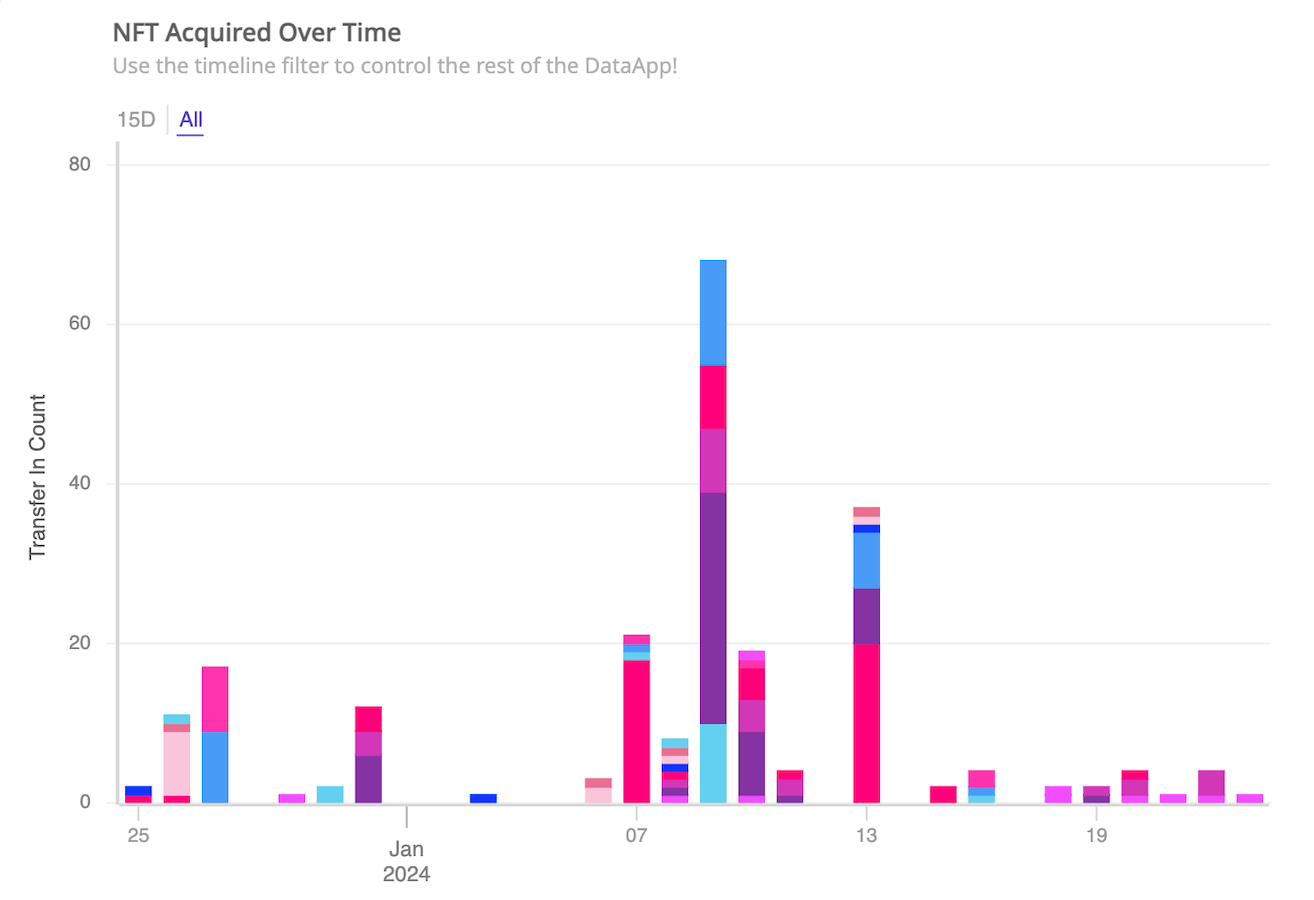
- Compare transaction volume and trends across marketplaces and time periods
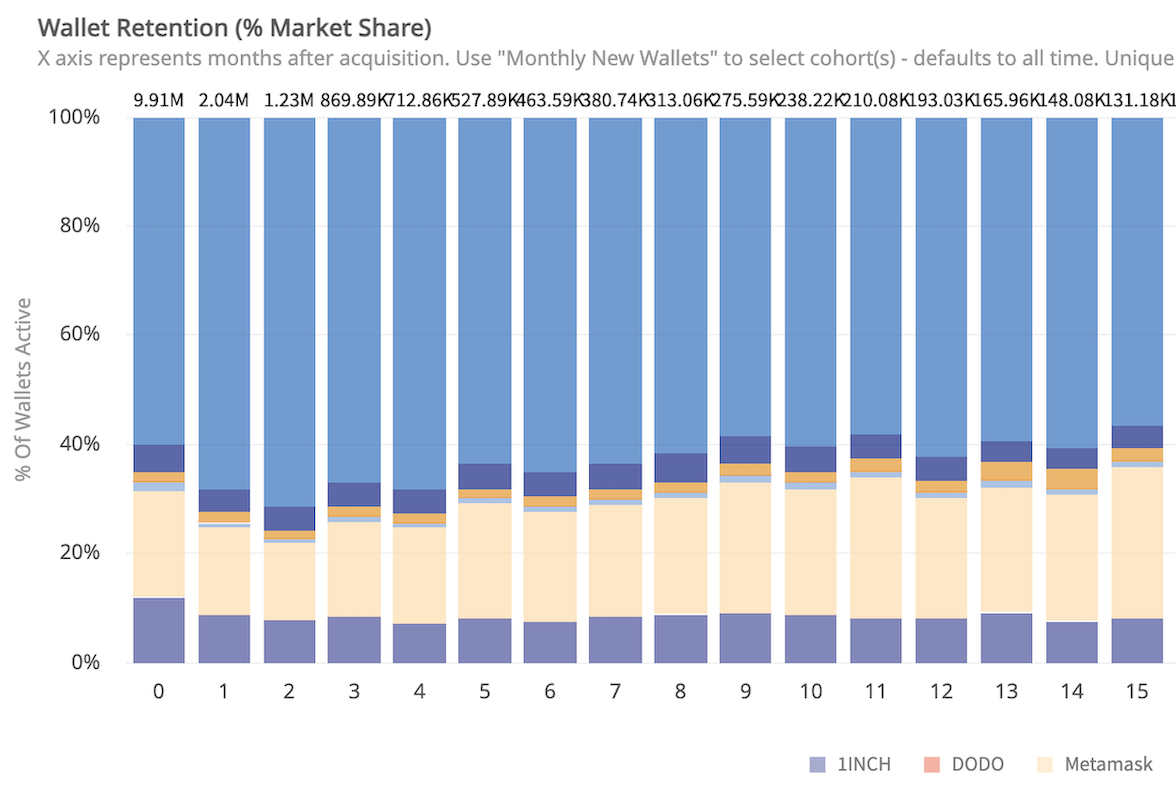
- Evaluate a collection’s holder activity and trends, and how this varies by cohort
- Understand holders' engagement with other collections and assets and use this to develop airdrop marketing strategies
Level 1 and Level 2 DataApps
- Get an overview of the top tokens being transacted on your blockchain and segment the active wallets
- Delve into the activity for a specific dApp, understanding their share of transactions, recent growth and number of users
- Explore the distribution of wallets and their assets, focusing on the most active segment and their activity on other chains

And many, many more...
DataApps are for everyone
Understand market drivers
Take a look at a token's past volume and dig into periods of outlier activity to understand what drove it.
Using rich visualizations
Try different charts and visualizations to tease out the story you want to tell.
With unmatched speed
Sift through billions of transactions and data points to find the nuggets and insights you need.
Dig into your project's volume trends
Quickly build a query using our drag-and-drop interface.
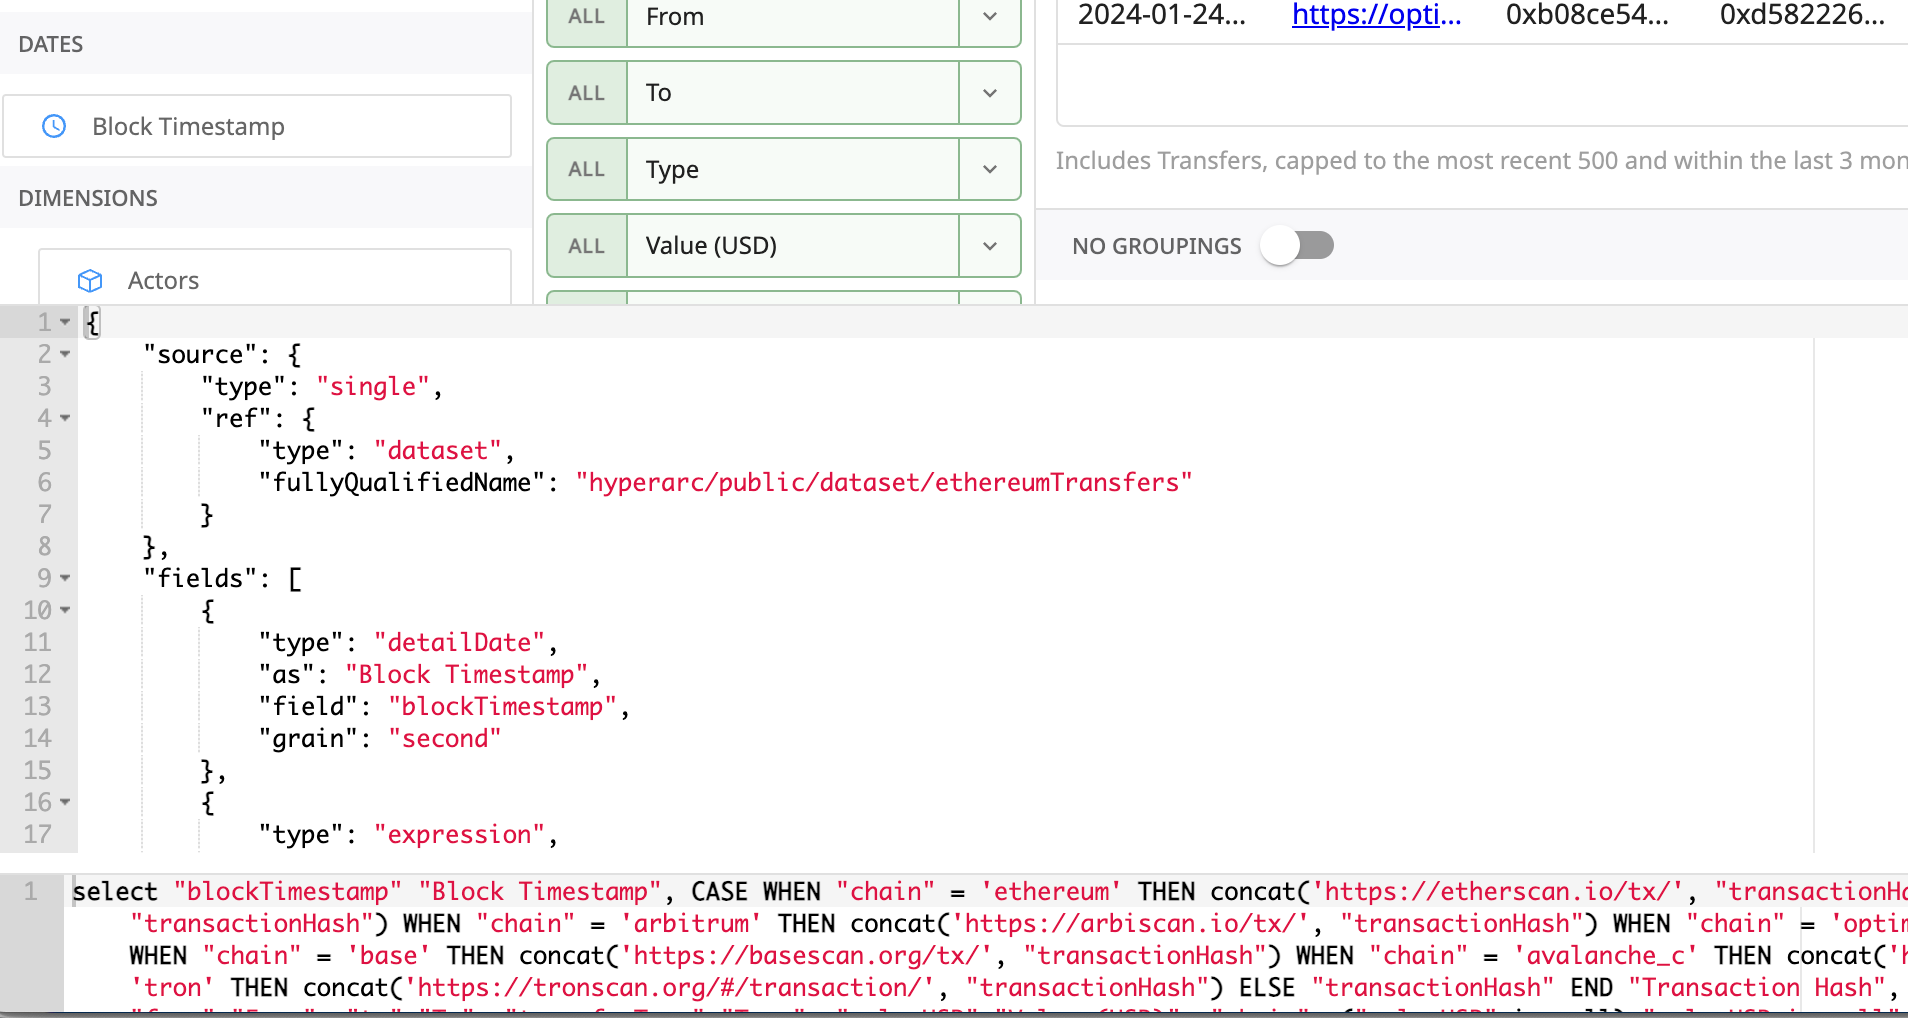
Refine the query using SQL
Get to a specific data point by further refining the query, using SQL or our own language.
Create an API
User our platform to provide unique data to your app or project.
Start by segmenting your users
Build a simple DataApp to identify your different user types, by transaction volume, assets or some other metric.
Identify segments ripe for airdrops
Based on segment activity across tokens and protocols, find the one that is most likely to respond to a new token airdrop.
Share with your team
Share the DataApp with your team. They can dig in as well, and fork the DataApp to explore other possibilities.
Build a cohort analysis
Use our different visualizations to understand how performance varies across cohort.
Identify drivers of activity
For cohorts that show different levels of activity, dig into their potential differences (e.g., assets held, protocols they transact with, etc.).
Set up triggers based on events
Get notified, and initiate processes, based on when user cohorts hit certain milestones or characteristics.